This is a web application to visualize various famous technical indicators and stocks tickers from user

Overview

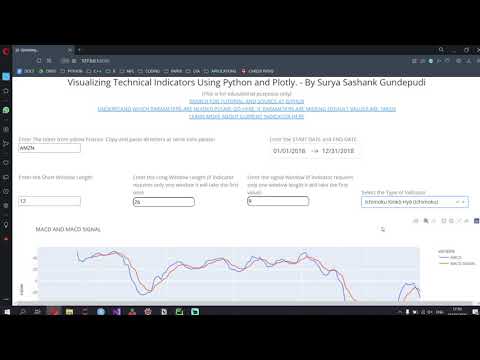
Visualizing Technical Indicators Using Python and Plotly.

Currently facing issues hosting the application on heroku. As soon as I am able to I'll like the live application here. Until then please check the demo below.

Please refer to the demo video below to understand how it works. (No audio available for the damo)

Demo VIDEO

This is version 1 of the web applicaiton

About the Web app.

With this web applicaiton I aim to provide a free open source method for people to visualize and understand various technical indicators. People can use this applicaiton to select various technical indicators and then visualize and interact with them. This can help new financial engineers get a better understanding of how various parameters of a technical indicator will affect the way we execute trades. It uses the technical analysis library available for python and Plotly's interactive visualization tools to provide the user with a dynamically changing and interactive tool.

Since this is just version 1 of the application I am yet to fix a lot of bugs and improve on it. So do bear with some of the little nuances. In case you would like to send any suggestions please email me at [email protected].

Some features

  1. Interactive visualization
  2. Dynamically changing environment
  3. Users can look up the indicator with the link provided
  4. Any stock across yahoo finance is available

Tutorial on how to use the application.

To use this one must follow the steps below

  1. Open the web applicaiton in your browser
  2. Open Yahoo finance and search for the stock for which you wish to plot the indicator for
  3. Copy the ticker value for the stock from Yahoo FInance
  4. Paste it in the input box of the applicaiton
  5. Select the indicator.
  6. Select the date range and other input parameters based on the indicator
  7. In case you would like to learn more about the indicator click on the link that says "TO learn more about current indicator please click here"

For any suggestions please email me.

Indicators as of Version 1 of the web application.

1. Accumulation/Distribution Index
2. Aroon Indicator
3. Average Directional index
4. Average True Range (ATR)
5. Awesome Oscillator
6. Bollinger Bands (std - 2)
7. Chaikin Money Flow (CMF)
8. Cummilative Return
9. Daily Return
10. Donchian Channel Bands
11. Ease of Movement
12. Exponential Moving Average
13. Ichimoku Kinkō Hyō (Ichimoku)
14. Kaufman’s Adaptive Moving Average', 'value': 'KAMA'},
15. Kelter Channel Index
16. Money Flow index
17. MACD
18. Negative Volume Index Indicator
19. Percentage Price Oscillator
20. Percentage Volume Oscillator
21. Rate of Change
22. Relative Strength Index (RSI)
23. Simple Moving Average
24. Ulcer Index
25. Volume Weighted Average Price
26. Weighted Moving Average

This web application is made for academic purposes only

Owner
I am currently a Senior at SSN College of Engineering My interests lie in Data Analysis and Computational Finance and I wish to pursue a career in the same
nvitop, an interactive NVIDIA-GPU process viewer, the one-stop solution for GPU process management

An interactive NVIDIA-GPU process viewer, the one-stop solution for GPU process management.

Xuehai Pan 1.3k Jan 02, 2023
This is a Cross-Platform Plot Manager for Chia Plotting that is simple, easy-to-use, and reliable.

Swar's Chia Plot Manager A plot manager for Chia plotting: https://www.chia.net/ Development Version: v0.0.1 This is a cross-platform Chia Plot Manage

Swar Patel 1.3k Dec 13, 2022
A Python function that makes flower plots.

Flower plot A Python 3.9+ function that makes flower plots. Installation This package requires at least Python 3.9. pip install

Thomas Roder 4 Jun 12, 2022
Sprint planner considering JIRA issues and google calendar meetings schedule.

Sprint planner Sprint planner is a Python script for planning your Jira tasks based on your calendar availability. Installation Use the package manage

Apptension 2 Dec 05, 2021
Easily configurable, chart dashboards from any arbitrary API endpoint. JSON config only

Flask JSONDash Easily configurable, chart dashboards from any arbitrary API endpoint. JSON config only. Ready to go. This project is a flask blueprint

Chris Tabor 3.3k Dec 31, 2022
Custom Plotly Dash components based on Mantine React Components library

Dash Mantine Components Dash Mantine Components is a Dash component library based on Mantine React Components Library. It makes it easier to create go

Snehil Vijay 239 Jan 08, 2023
The official colors of the FAU as matplotlib/seaborn colormaps

FAU - Colors The official colors of Friedrich-Alexander-Universität Erlangen-Nürnberg (FAU) as matplotlib / seaborn colormaps. We support the old colo

Machine Learning and Data Analytics Lab FAU 9 Sep 05, 2022
This is my favourite function - the Rastrigin function.

This is my favourite function - the Rastrigin function. What sparked my curiosity and interest in the function was its complexity in terms of many local optimum points, which makes it particularly in

1 Dec 27, 2021
This is a Web scraping project using BeautifulSoup and Python to scrape basic information of all the Test matches played till Jan 2022.

Scraping-test-matches-data This is a Web scraping project using BeautifulSoup and Python to scrape basic information of all the Test matches played ti

Souradeep Banerjee 4 Oct 10, 2022
Chem: collection of mostly python code for molecular visualization, QM/MM, FEP, etc

chem: collection of mostly python code for molecular visualization, QM/MM, FEP,

5 Sep 02, 2022
Python code for solving 3D structural problems using the finite element method

3DFEM Python 3D finite element code This python code allows for solving 3D structural problems using the finite element method. New features will be a

Rémi Capillon 6 Sep 29, 2022
University of Missouri - Kansas City: CS451R: Capstone

CS451RC University of Missouri - Kansas City: CS451R: Capstone Installation cd git clone https://github.com/ala2q6/CS451RC.git cd CS451RC pip3 instal

Alex Arbuckle 1 Nov 17, 2021
LabGraph is a a Python-first framework used to build sophisticated research systems with real-time streaming, graph API, and parallelism.

LabGraph is a a Python-first framework used to build sophisticated research systems with real-time streaming, graph API, and parallelism.

MLH Fellowship 7 Oct 05, 2022
The Metabolomics Integrator (MINT) is a post-processing tool for liquid chromatography-mass spectrometry (LCMS) based metabolomics.

MINT (Metabolomics Integrator) The Metabolomics Integrator (MINT) is a post-processing tool for liquid chromatography-mass spectrometry (LCMS) based m

Sören Wacker 0 May 04, 2022
This is a small repository for me to implement my simply Data Visualisation skills through Python.

Data Visualisations This is a small repository for me to implement my simply Data Visualisation skills through Python. Steam Population Chart from 10/

9 Dec 31, 2021
Plot toolbox based on Matplotlib, simple and elegant.

Elegant-Plot Plot toolbox based on Matplotlib, simple and elegant. 绘制效果 绘制过程 数据准备 每种图标类型的目录下有data.csv文件,依据样例数据填入自己的数据。

3 Jul 15, 2022
Sky attention heatmap of submissions to astrometry.net

astroheat Installation Requires Python 3.6+, Tested with Python 3.9.5 Install library dependencies pip install -r requirements.txt The program require

4 Jun 20, 2022
Parallel t-SNE implementation with Python and Torch wrappers.

Multicore t-SNE This is a multicore modification of Barnes-Hut t-SNE by L. Van der Maaten with python and Torch CFFI-based wrappers. This code also wo

Dmitry Ulyanov 1.7k Jan 09, 2023
Fastest Gephi's ForceAtlas2 graph layout algorithm implemented for Python and NetworkX

ForceAtlas2 for Python A port of Gephi's Force Atlas 2 layout algorithm to Python 2 and Python 3 (with a wrapper for NetworkX and igraph). This is the

Bhargav Chippada 227 Jan 05, 2023
A tool for automatically generating 3D printable STLs from freely available lidar scan data.

mini-map-maker A tool for automatically generating 3D printable STLs from freely available lidar scan data. Screenshots Tutorial To use this script, g

Mike Abbott 51 Nov 06, 2022