Collection of data visualizing projects through Tableau, Data Wrapper, and Power BI

Overview

Data-Visualization-Projects

Collection of data visualizing projects through Tableau, Data Wrapper, and Power BI

Indigenous-Brands-Social-Movements

Python(Pandas, NumPy, Re, Matplotlib), Data Visualization(Data Wrapper)

Selected as a part of competitive UC Berkeley Data Discovery Research Programs, "Indigenous Brands & Social Movements"

  • Cleaned datasets of trademarks owned by Native American Tribes through eliminating unnecessary columns, filling NAs with 0 other values
  • Based on the cleaned datasets, visualized locations of the trademarks on maps through usage of data visualization tool called DataWrapper

Research Program Description

Have you noticed how many brands in the marketplace use indigenous/Native American - oriented terms and imagery? From the notorious Washington Team to the logo on Land of Lakes butter, indigenous imagery and appropriation is everywhere, and worthy of serious study and data analysis. This project aims to bring the work of social movements and activism to a data-intensive study of First Nations brands and trademarks in order to chart a path forward. In this project, we will study how many of these terms are owned by native vs. non-native entities, study how these brands have changed over time, and how the law might be better deployed to protect ownership of indigenously oriented trademarks, and encourage retiring marks that are considered offensive or appropriative.

  • University of California, Berkeley / Data Discovery Research Program Project

Visualization of Homeless in the States using Tableau

Screen Shot 2021-08-18 at 9 07 04 PM

  • Dataset of statistics of homeless from Kaggle and Github

  • This dashboard answers the followings:

    • Which state has the most number of homeless?
    • Is there a difference of the number of homeless between 2012 and 2013?
    • In what state and how many of homeless people of each type(Unsheltered, families, veterans, unaccompanied children, and chronic) are there?
  • This dashboard is composed of the followings:

    • Bubbles of the number of homeless by the States
    • Map of the United States by the number of homeless
    • Stacked bar of the number of homeless for each type with selected State
    • Side-by-Side bar chart of the number of homeless in 2012 and 2013
  • Individual Project by Jinwoo(Roy) Yoon

Finance Report using PowerBI

Screen Shot 2022-02-05 at 3 47 12 PM

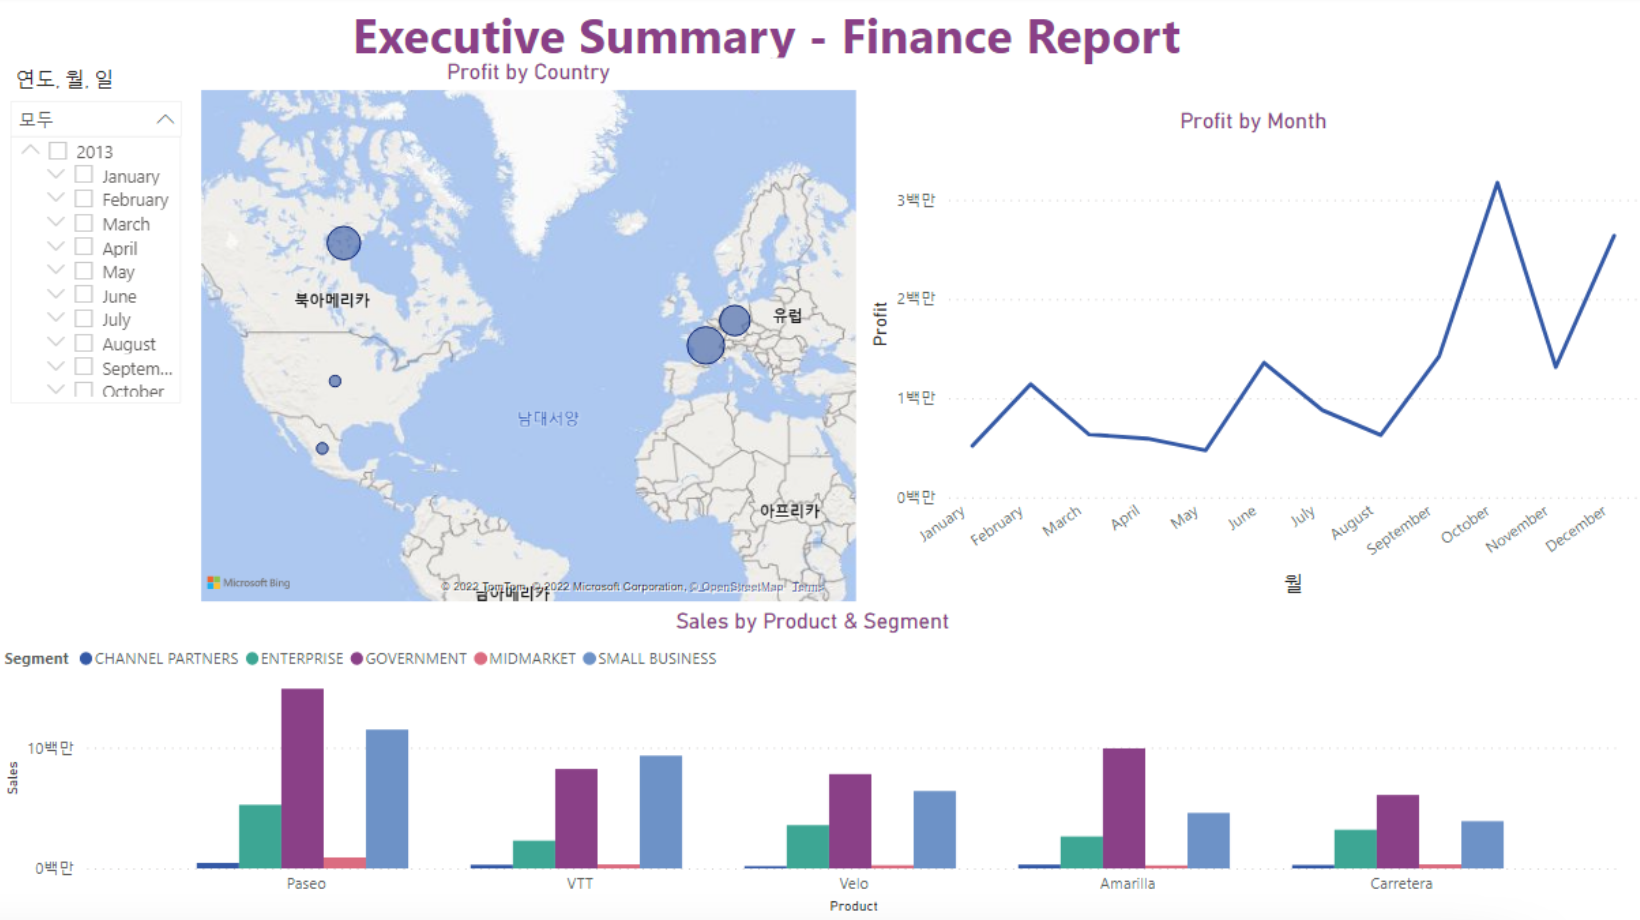
  • Sample dataset (From Power BI) of a company's sales of products with various countries and dates
  • This dashboard answers the followings:
    • Which month/year was the most profitable?
    • In which country was the most profitable?
    • Which segment should the company invest more?
  • This dashboard is composed of the followings:
    • Map of the North America and Europe showing the amount of sales
    • Graph of profit from sales by months
    • Bar chart of sales by products/segments
  • Individual Project by Jinwoo(Roy) Yoon
Owner
Jinwoo(Roy) Yoon
Rising Senior at University of California, Berkeley Data Science (May 2023)
Jinwoo(Roy) Yoon
Here are my graphs for hw_02

Let's Have A Look At Some Graphs! Graph 1: State Mentions in Congressperson's Tweets on 10/01/2017 The graph below uses this data set to demonstrate h

7 Sep 02, 2022
Visualize the training curve from the *.csv file (tensorboard format).

Training-Curve-Vis Visualize the training curve from the *.csv file (tensorboard format). Feature Custom labels Curve smoothing Support for multiple c

Luckky 7 Feb 23, 2022
Visualise Ansible execution time across playbooks, tasks, and hosts.

ansible-trace Visualise where time is spent in your Ansible playbooks: what tasks, and what hosts, so you can find where to optimise and decrease play

Mark Hansen 81 Dec 15, 2022
Open-source demos hosted on Dash Gallery

Dash Sample Apps This repository hosts the code for over 100 open-source Dash apps written in Python or R. They can serve as a starting point for your

Plotly 2.7k Jan 07, 2023
Machine learning beginner to Kaggle competitor in 30 days. Non-coders welcome. The program starts Monday, August 2, and lasts four weeks. It's designed for people who want to learn machine learning.

30-Days-of-ML-Kaggle 🔥 About the Hands On Program 💻 Machine learning beginner → Kaggle competitor in 30 days. Non-coders welcome The program starts

Roja Achary 145 Jan 01, 2023
A data visualization curriculum of interactive notebooks.

A data visualization curriculum of interactive notebooks, using Vega-Lite and Altair. This repository contains a series of Python-based Jupyter notebooks.

UW Interactive Data Lab 1.2k Dec 30, 2022
Automatically generate GitHub activity!

Commit Bot Automatically generate GitHub activity! We've all wanted to be the developer that commits every day, but that requires a lot of work. Let's

Ricky 4 Jun 07, 2022
LabGraph is a a Python-first framework used to build sophisticated research systems with real-time streaming, graph API, and parallelism.

LabGraph is a a Python-first framework used to build sophisticated research systems with real-time streaming, graph API, and parallelism.

MLH Fellowship 7 Oct 05, 2022
Data science project for exploratory analysis on the kcse grades dataset (Kamilimu Data Science Track)

Kcse-Data-Analysis Data science project for exploratory analysis on the kcse grades dataset (Kamilimu Data Science Track) Findings The performance of

MUGO BRIAN 1 Feb 23, 2022
Open-questions - Open questions for Bellingcat technical contributors

Open questions for Bellingcat technical contributors These are difficult, long-term projects that would contribute to open source investigations at Be

Bellingcat 234 Dec 31, 2022
PanGraphViewer -- show panenome graph in an easy way

PanGraphViewer -- show panenome graph in an easy way Table of Contents Versions and dependences Desktop-based panGraphViewer Library installation for

16 Dec 17, 2022
This is my favourite function - the Rastrigin function.

This is my favourite function - the Rastrigin function. What sparked my curiosity and interest in the function was its complexity in terms of many local optimum points, which makes it particularly in

1 Dec 27, 2021
Python scripts for plotting audiograms and related data from Interacoustics Equinox audiometer and Otoaccess software.

audiometry Python scripts for plotting audiograms and related data from Interacoustics Equinox 2.0 audiometer and Otoaccess software. Maybe similar sc

Hamilton Lab at UT Austin 2 Jun 15, 2022
A site that displays up to date COVID-19 stats, powered by fastpages.

https://covid19dashboards.com This project was built with fastpages Background This project showcases how you can use fastpages to create a static das

GitHub 1.6k Jan 07, 2023
a plottling library for python, based on D3

Hello August 2013 Hello! Maybe you're looking for a nice Python interface to build interactive, javascript based plots that look as nice as all those

Mike Dewar 1.4k Dec 28, 2022
Fractals plotted on MatPlotLib in Python.

About The Project Learning more about fractals through the process of visualization. Built With Matplotlib Numpy License This project is licensed unde

Akeel Ather Medina 2 Aug 30, 2022
Customizing Visual Styles in Plotly

Customizing Visual Styles in Plotly Code for a workshop originally developed for an Unconference session during the Outlier Conference hosted by Data

Data Design Dimension 9 Aug 03, 2022
This is a learning tool and exploration app made using the Dash interactive Python framework developed by Plotly

Support Vector Machine (SVM) Explorer This app has been moved here. This repo is likely outdated and will not be updated. This is a learning tool and

Plotly 150 Nov 03, 2022
3D-Lorenz-Attractor-simulation-with-python

3D-Lorenz-Attractor-simulation-with-python Animação 3D da trajetória do Atrator de Lorenz, implementada em Python usando o método de Runge-Kutta de 4ª

Hevenicio Silva 17 Dec 08, 2022
A research of IT labor market based especially on hh.ru. Salaries, rate of technologies and etc.

hh_ru_research Проект реализован в учебных целях анализа рынка труда, в особенности по hh.ru Input data В качестве входных данных используются сериали

3 Sep 07, 2022